


Airflow and lung volume measurements can be used to differentiate obstructive from restrictive pulmonary disorders, to characterize severity, and to measure responses to therapy. Measurements are typically reported as absolute flows and volumes and as percentages of predicted values using data derived from large populations of people presumed to have normal lung function. Variables used to predict normal values include age, sex, ethnicity, and height.
Whether to correct for ethnicity is controversial. For example, historical cohorts of primarily American and European adults showed lower lung volumes in multiple non-White ethnic groups (eg, Blacks, Hispanics, Asians) than in Whites. However, environmental and other nongenetic factors are thought by some to be equally or more important than genetic differences in explaining these differences. Studies have found that unadjusted flow and volume values are more predictive of patient outcomes than ethnically adjusted values, suggesting that these adjustments may result in under-recognition (and thus undertreatment) of true decreases in pulmonary function in non-White individuals.
Airflow
Quantitative measures of inspiratory and expiratory flow are obtained by forced spirometry. Nose clips are used to occlude the nares.
In expiratory flow assessments, patients inhale as deeply as possible, seal their lips around a mouthpiece, and exhale as forcefully and completely as possible into an apparatus that records the exhaled volume (forced vital capacity [FVC]) and the volume exhaled in the first second (the forced expiratory volume in 1 second [FEV1]—see figure Normal spirogram). Most currently used devices measure only airflow and integrate time to estimate the expired volume.
In inspiratory flow and volume assessments, patients exhale as completely as possible, then forcibly inhale.
These maneuvers provide several measures:
FVC: Maximal amount of air that the patient can forcibly exhale after taking a maximal inhalation
FEV1: Volume exhaled in the first second
Peak expiratory flow (PEF): Maximal speed of airflow as the patient exhales
FEV1 is the most reproducible flow parameter and is especially useful in diagnosing and monitoring patients with obstructive pulmonary disorders (eg, asthma, COPD [chronic obstructive pulmonary disease]).
FEV1 and FVC help differentiate obstructive and restrictive lung disorders. A normal FEV1 makes irreversible obstructive lung disease unlikely whereas a normal FVC makes restrictive disease unlikely.
Normal spirogram
FEF25–75% = forced expiratory flow during expiration of 25 to 75% of the FVC; FEV1 = forced expiratory volume in the first second of forced vital capacity maneuver; FVC = forced vital capacity (the maximum amount of air forcibly expired after maximum inspiration). |

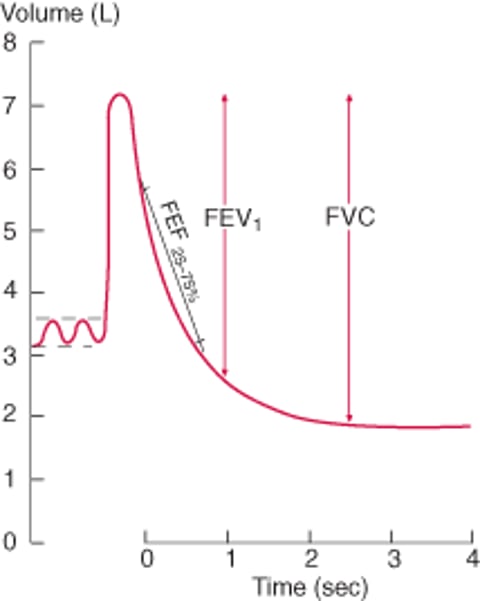
The forced expiratory flow averaged over the time during which 25 to 75% of the FVC is exhaled may be a more sensitive marker of mild, small airway airflow limitation than the FEV1, but the reproducibility of this variable is poor.
The peak expiratory flow (PEF) is the peak flow occurring during exhalation. This variable is used primarily for home monitoring of patients with asthma and for determining diurnal variations in airflow.
Interpretation of these measures depends on good patient effort, which is often improved by coaching during the actual maneuver. Acceptable spirograms demonstrate
Good test initiation (eg, a quick and forceful onset of exhalation)
No coughing
Smooth curves
Absence of early termination of expiration (eg, minimum exhalation time of 6 seconds with no change in volume for the last 1 second)
Reproducible efforts agree within 5% or 100 mL with other efforts. Results not meeting these minimum acceptable criteria should be interpreted with caution.
Lung volume
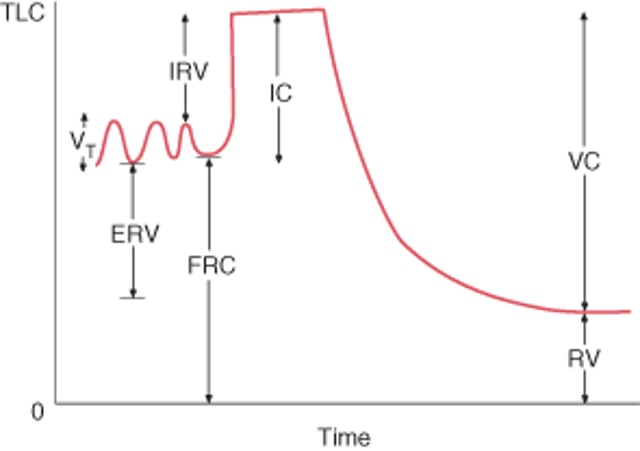
Lung volumes are measured by determining functional residual capacity (FRC). FRC is the amount of air remaining in the lungs after normal exhalation. The total lung capacity (TLC) is the volume of gas that is contained in the lungs at the end of maximal inspiration.
Normal lung volumes
ERV = expiratory reserve volume; FRC = functional residual capacity; IC = inspiratory capacity; IRV = inspiratory reserve volume; RV = residual volume; TLC = total lung capacity; VC = vital capacity; VT= tidal volume. FRC = RV + ERV; IC = VT + IRV; VC = VT+ IRV + ERV. |

FRC is measured using gas dilution techniques or a plethysmograph (which is more accurate in patients who have airflow limitation and trapped gas).
Gas dilution techniques include
Nitrogen washout
Helium equilibration
With nitrogen washout, the patient exhales to FRC and then breathes from a spirometer containing 100% oxygen. The test ends when the exhaled nitrogen concentration is zero. The collected volume of exhaled nitrogen is equal to 81% of the initial FRC.
With helium equilibration, the patient exhales to FRC and then is connected to a closed system containing known volumes of helium and oxygen. Helium concentration is measured until it is the same on inhalation and exhalation, indicating it has equilibrated with the volume of gas in the lung, which can then be estimated from the change in helium concentration that has occurred.
Both of these techniques may underestimate FRC because they measure only the lung volume that communicates with the airways. In patients with severe airflow limitation, a considerable volume of trapped gas may communicate very poorly or not at all.
Body plethysmography uses Boyle’s law to measure the compressible gas volume within the thorax and is more accurate than gas dilution techniques. While sitting in an airtight box, the patient tries to inhale against a closed mouthpiece from FRC. As the chest wall expands, the pressure in the closed box rises. Knowing the pre-inspiratory box volume and the pressure in the box before and after the inspiratory effort allows for calculation of the change in box volume, which must equal the change in lung volume.


Knowing FRC allows the lungs to be divided into subvolumes that are either measured with spirometry or calculated (see figure Normal lung volumes). Normally the FRC represents about 40% of TLC.
Flow-volume loop
In contrast to the spirogram, which displays airflow (in L) over time (in seconds), the flow-volume loop displays airflow (in L/second) as it relates to lung volume (in L) during maximal inspiration from complete exhalation (residual volume [RV]) and during maximum expiration from complete inhalation (TLC). The principal advantage of the flow-volume loop is that it can show whether airflow is appropriate for a particular lung volume. For example, airflow is normally slower at low lung volumes because elastic recoil is lower at lower lung volumes. Patients with pulmonary fibrosis have low lung volumes and their airflow appears to be decreased if measured alone. However, when airflow is presented as a function of lung volume, it becomes apparent that airflow is actually higher than normal (as a result of the increased elastic recoil characteristic of fibrotic lungs).
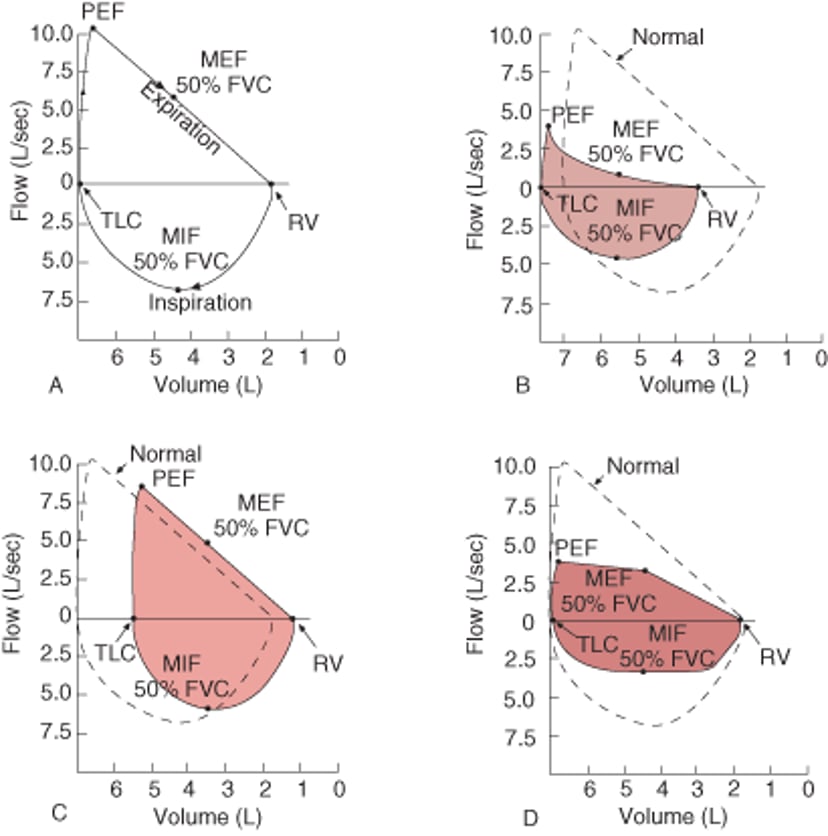
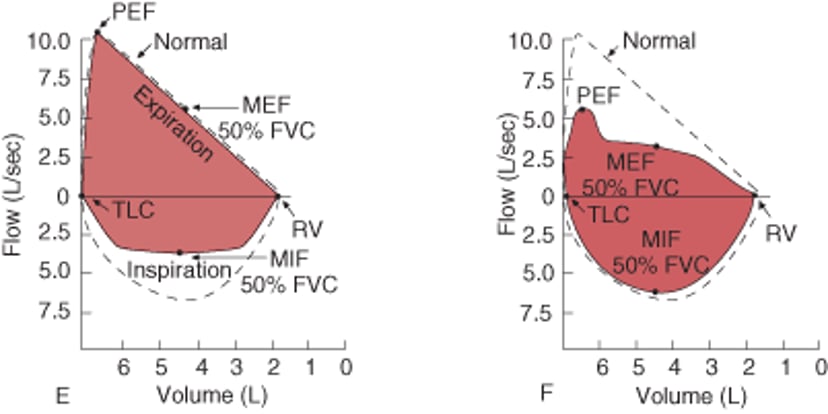
Flow-volume loops
(A) Normal. Inspiratory limb of loop is symmetric and convex. Expiratory limb is linear. Airflow at the midpoint of inspiratory capacity and airflow at the midpoint of expiratory capacity are often measured and compared. Maximal inspiratory airflow at 50% of forced vital capacity (MIF 50% FVC) is greater than maximal expiratory airflow at 50% FVC (MEF 50% FVC) because dynamic compression of the airways occurs during exhalation. (B) Obstructive disorder (eg, emphysema, asthma). Although all airflow is diminished, expiratory prolongation predominates, and MEF < MIF. Peak expiratory flow is sometimes used to estimate degree of airway obstruction but depends on patient effort. (C) Restrictive disorder (eg, interstitial lung disease, kyphoscoliosis). The loop is narrowed because of diminished lung volumes. Airflow is greater than normal at comparable lung volumes because the increased elastic recoil of lungs holds the airways open. (D) Fixed obstruction of the upper airway (eg, tracheal stenosis, goiter). The top and bottom of the loops are flattened so that the configuration approaches that of a rectangle. Fixed obstruction limits flow equally during inspiration and expiration, and MEF = MIF. (E) Variable extrathoracic obstruction (eg, unilateral vocal cord paralysis, vocal cord dysfunction). When a single vocal cord is paralyzed, it moves passively with pressure gradients across the glottis. During forced inspiration, it is drawn inward, resulting in a plateau of decreased inspiratory flow. During forced expiration, it is passively blown aside, and expiratory flow is unimpaired. Therefore, MIF 50% FVC < MEF 50% FVC. (F) Variable intrathoracic obstruction (eg, tracheomalacia). During a forced inspiration, negative pleural pressure holds the floppy trachea open. With forced expiration, loss of structural support results in tracheal narrowing and a plateau of diminished flow. Airflow is maintained briefly before airway compression occurs. FVC = forced vital capacity; MEF = maximal expiratory flow; MIF = maximal inspiratory flow; PEF = peak expiratory flow; RV = residual volume; TLC = total lung capacity. |


Flow-volume loops require that absolute lung volumes be measured. Unfortunately, many laboratories simply plot airflow against the FVC; the flow-FVC loop does not have an inspiratory limb and therefore does not provide as much information.
Patterns of Abnormalities
Most common respiratory disorders can be categorized as obstructive or restrictive on the basis of airflow and lung volumes (see table Characteristic Physiologic Changes Associated With Pulmonary Disorders).
Obstructive disorders
Obstructive disorders are characterized by a reduction in airflow, particularly the FEV1 and the FEV1 expressed as a percentage of the FVC (FEV1/FVC). The degree of reduction in FEV1 compared with predicted values determines the degree of the obstructive defect (see table Severity of Obstructive and Restrictive Lung Disorders). Obstructive defects are caused by
Increased resistance to airflow due to abnormalities within the airway lumen (eg, tumors, secretions, mucosal thickening)
Changes in the wall of the airway (eg, contraction of smooth muscle, edema)
Decreased elastic recoil (eg, the parenchymal destruction that occurs in emphysema)
With decreased airflow, expiratory times are longer than usual, and air may become trapped in the lungs due to incomplete emptying, thereby increasing lung volumes (eg, TLC, RV).
Improvement of FEV1 and/or FVC ≥ 12% and 200 mL with the administration of a bronchodilator confirms the diagnosis of asthma or airway hyperresponsiveness. However, some patients with asthma can have normal pulmonary function and normal spirometric parameters between exacerbations. When suspicion of asthma remains high despite normal spirometry results, provocative testingacetylcholine< 1 mg/mL is considered diagnostic of increased bronchial reactivity, whereas a PC20 > 16 mg/mL excludes the diagnosis. PC20 values between 1 and 16 mg/mL are inconclusive.
Exercise testing≥ 15% after exercise.
Eucapnic voluntary hyperventilation (EVH) may also be used to diagnose exercised-induced bronchoconstriction. EVH involves hyperventilation of a gas mixture of 5% carbon dioxide and 21% oxygen at 85% of maximum voluntary ventilation for 6 minutes. FEV1 is then measured at specified intervals after the test. As with other bronchial provocation tests, the drop in FEV1 that is diagnostic of exercise-induced bronchospasm varies by laboratory.
Restrictive disorders
Restrictive disorders are characterized by a reduction in lung volume, specifically a TLC < 80% of the predicted value. However, in early restrictive disease, the TLC can be normal (as a result of strong inspiratory effort) and the only abnormality might be a reduction in RV. The decrease in TLC determines the severity of restriction (see table Severity of Obstructive and Restrictive Disorders). The decrease in lung volumes causes a decrease in airflow (reduced FEV1—see figure Flow-volume loops, B). However, airflow relative to lung volume is increased, so the FEV1/FVC ratio is normal or increased.
Restrictive defects are caused by the following:
Loss in lung volume (eg, lobectomy)
Abnormalities of structures surrounding the lung (eg, pleural disorder, kyphosis, obesity)
Weakness of the inspiratory muscles of respiration (eg, neuromuscular disorders)
Abnormalities of the lung parenchyma (eg, pulmonary fibrosis)
The feature common to all is a decrease in the compliance of the lungs, the chest wall, or both.


